What the Coating Line Doesn’t Tell You. Read the article
What the Coating Line Doesn’t Tell You. Read the article
The PlasmaSens™ platform uses cold atmospheric plasma and physics-informed machine learning to read the microstructure, properties and defects of materials non-destructively, in one scan. The same core technology comes in three physical implementations, from at-line to inline.

At-line & Off-line
At-line and lab characterization of flat samples. Built for quality labs, product development, R&D and incoming inspection.

Inline
Robot-mounted sensing for curved and contoured parts. Maps surface, bulk and subsurface properties, part after part.

Inline
Inline monitoring for roll-to-roll lines. Catch drift while the roll is still running, not after the material is processed.
PlasmaSmart™
Every PlasmaSens system is backed by PlasmaSmart, physics-informed software for materials characterization built on SirenOpt’s proprietary cold atmospheric plasma technology. It combines plasma physics with machine learning to turn raw signals into answers you can act on.
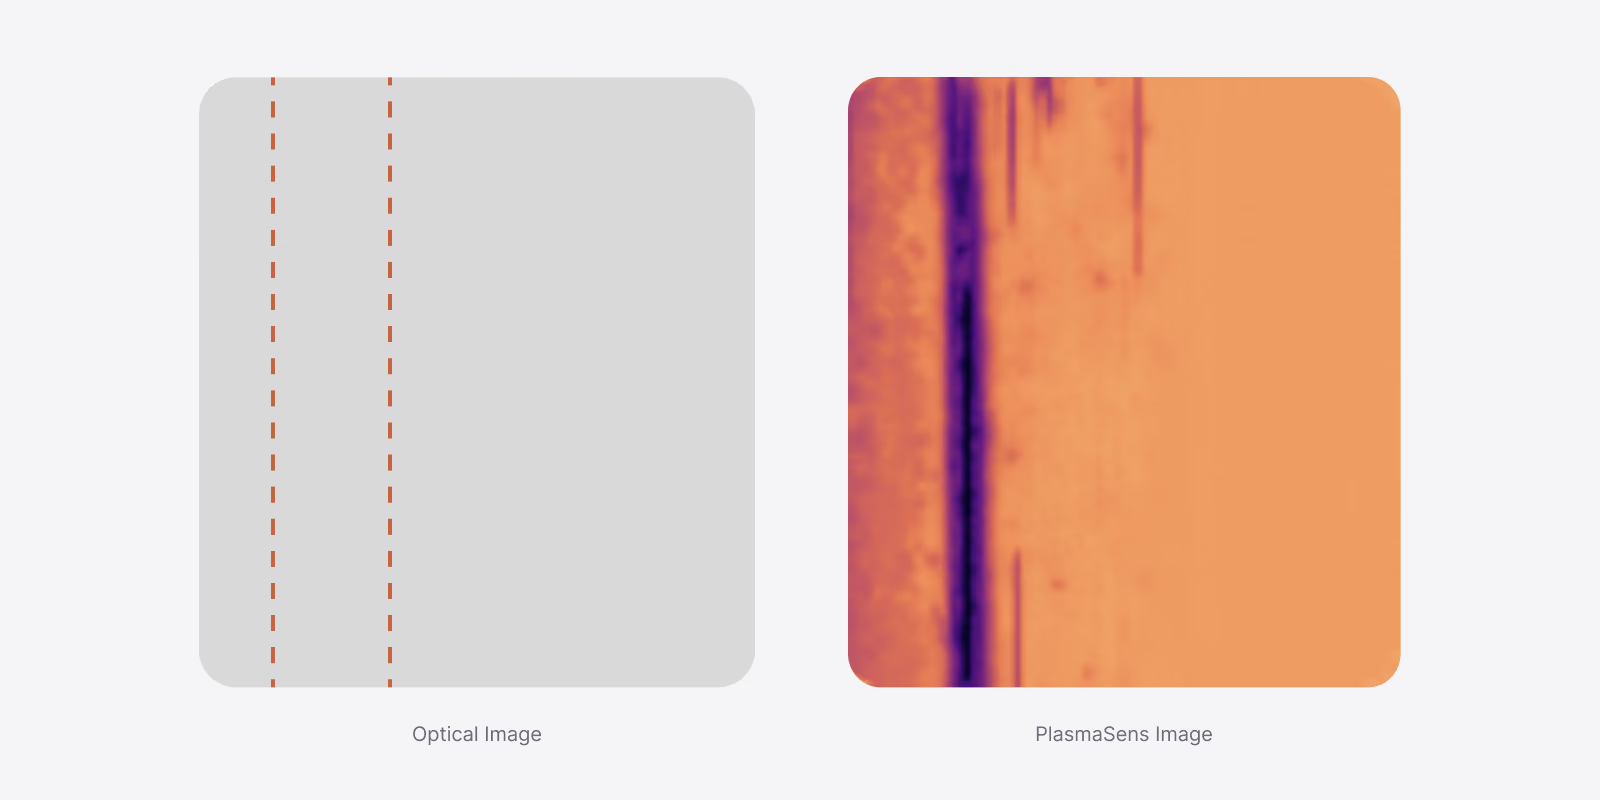
PlasmaSmart extracts about 9,000 physics-based features from each scan, and each one can be shown as a spatial map. Different maps reveal different things: defects, property variations or subtle changes in microstructure. Here, a wrinkle in a polymer film that cannot be seen by eye appears as a clear line on one of the signal maps.

Each scan records optical, thermal and electrical signals at every point, and the same data is used to measure several properties at once. Every value comes from the same location, so when one property changes, you can see how the others move at that position.

Defects and contaminants change how the plasma interacts with the material. That change shows up in the plasma’s optical emission. Each contaminant shows a unique signature that can be detected and, once calibrated, identified. Here, copper, iron and aluminum show distinct signatures compared to the uncontaminated NMC cathode.
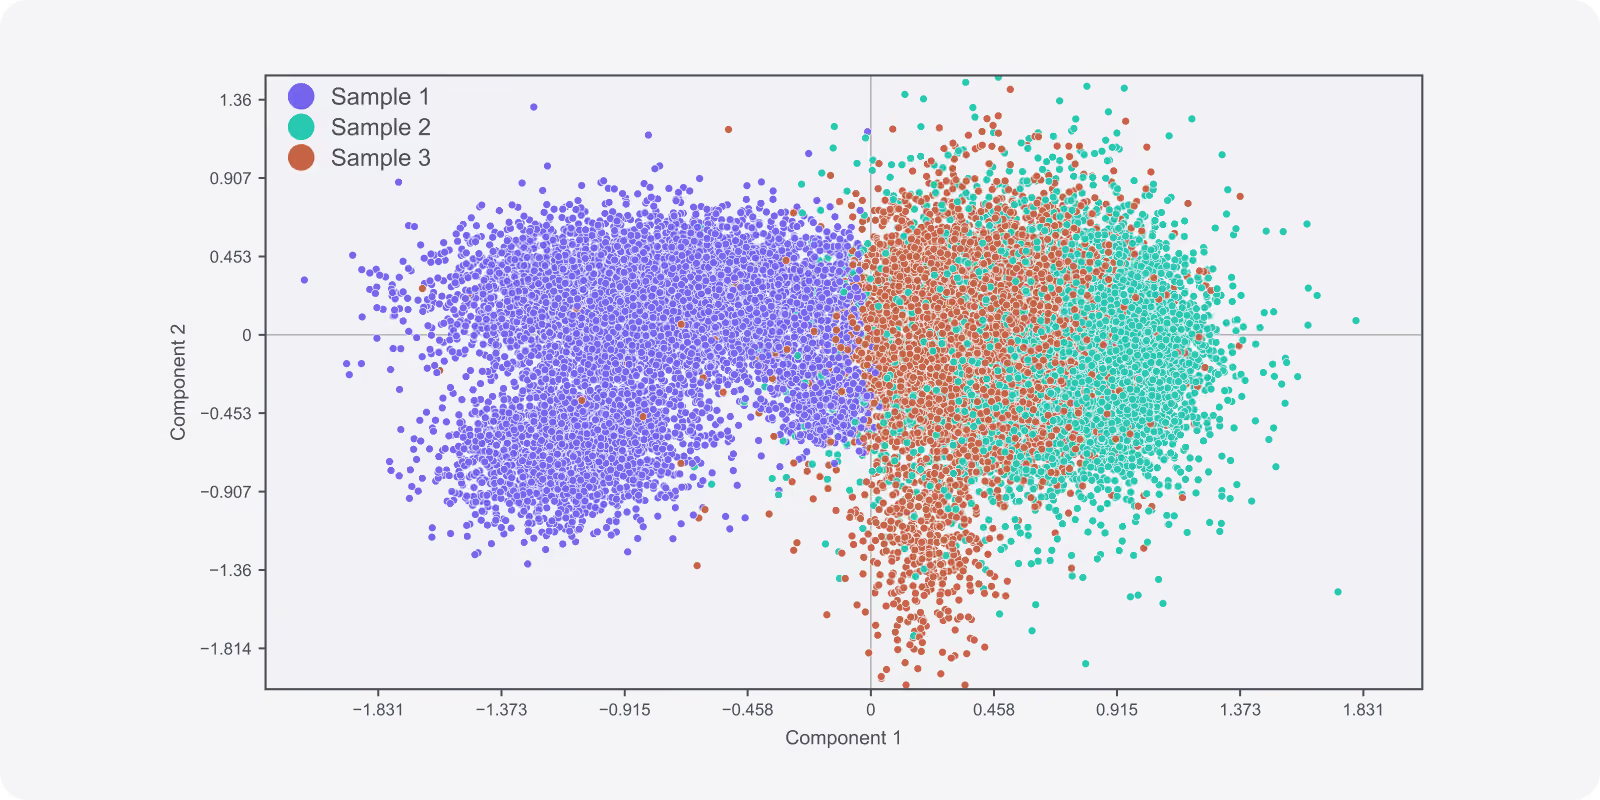
Three samples from the same process show differences in their interaction with plasma. A low-dimensional representation of the plasma-material interactions reveals that Sample 1 is measurably different from Samples 2 and 3.
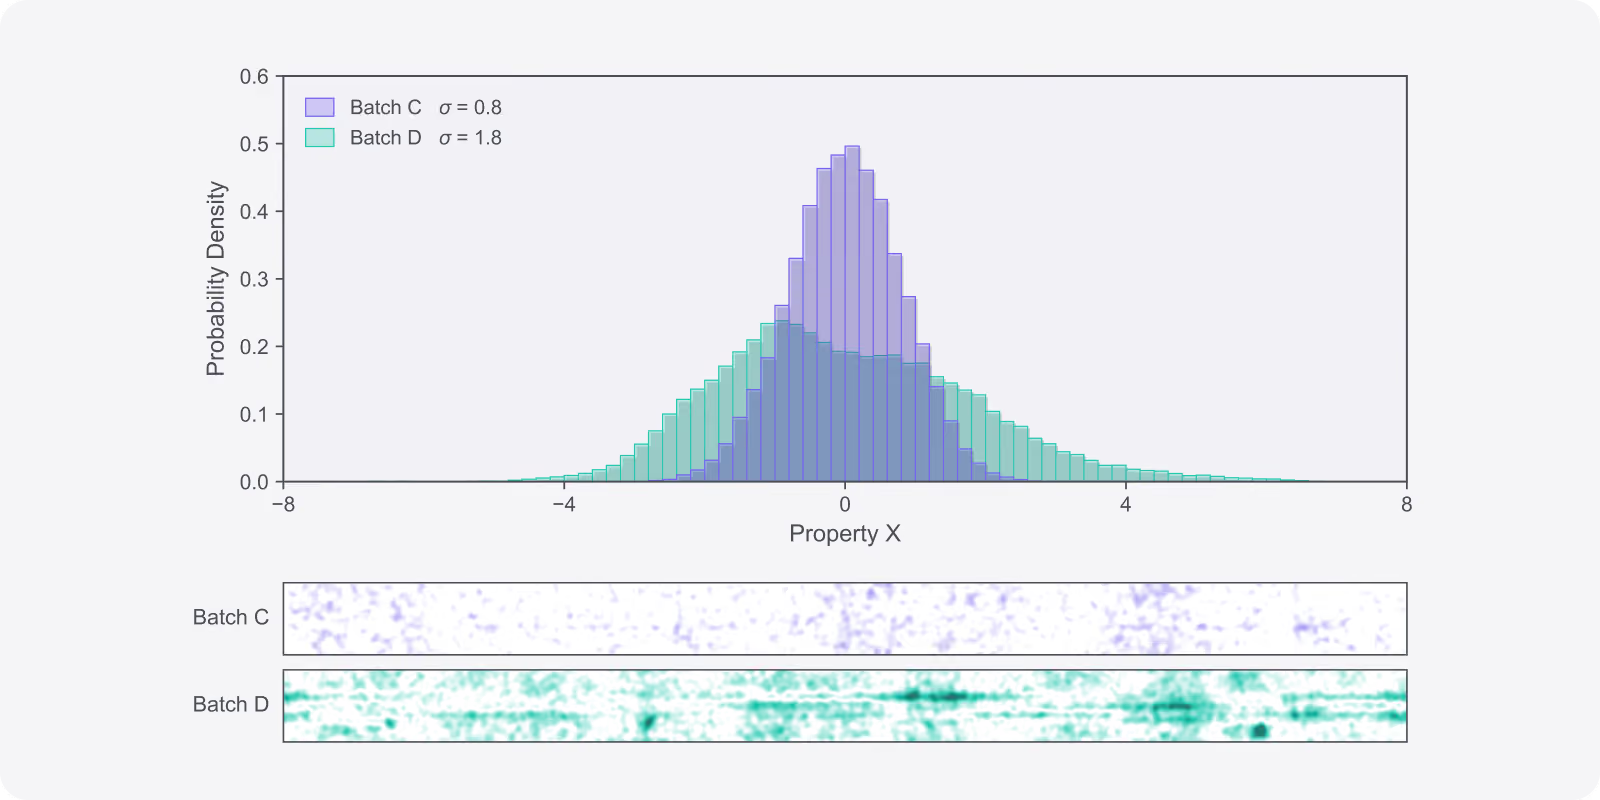
Two batches with the same average for Property X but a different spread. The maps show that Batch D varies more than Batch C, and where. If the quality requirement calls for a tight distribution, Batch D can be flagged for inspection before it is used.